The search for a formula for the future

Over the past twelve months, researchers on the MOSAiC expedition in the Arctic have collected unique data that will help them to better understand the Earth’s complex climate interactions and to improve corresponding models.
Heat waves, storms, and heavy rain – what will our world look like 20, 50, or 100 years from now? This question is not only scientifically relevant; it also has an impact on every one of us in our day-to-day lives. But how can researchers predict the effects of advancing climate change? What role do the processes in the Arctic in particular play? Researchers are using climate models to predict what to expect.
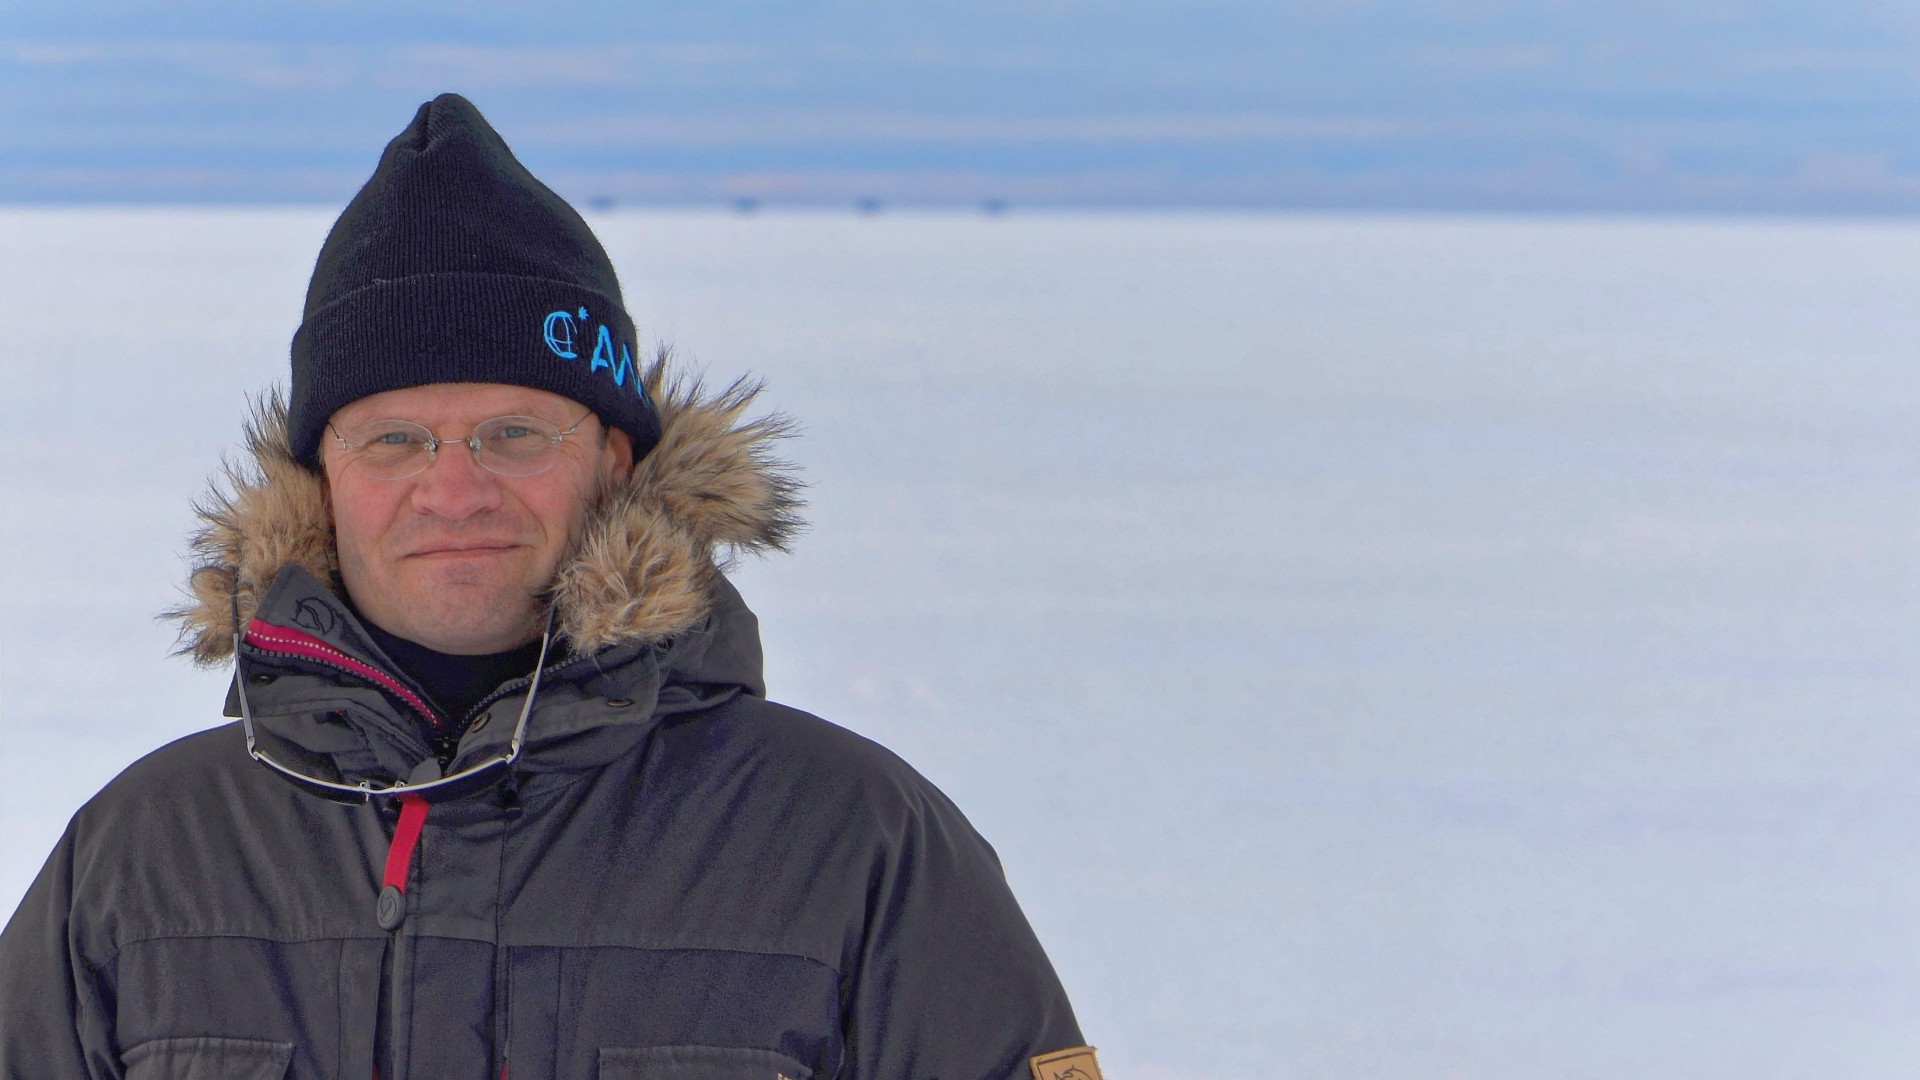
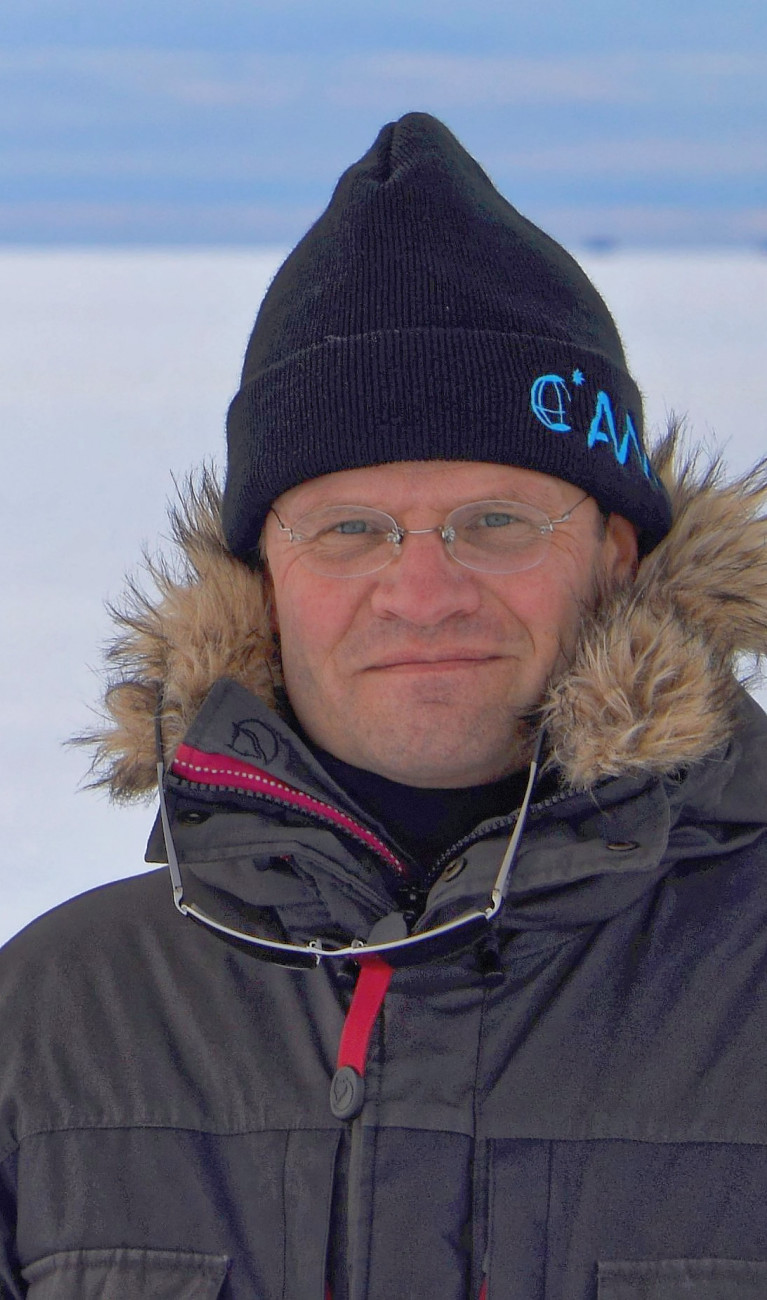

The Multidisciplinary drifting Observatory for the Study of Arctic Climate (MOSAiC) expedition is making a unique contribution to these efforts. For one year, it led the research icebreaker Polarstern with changing teams through the North Pole region. Even though the Arctic may be far away from most people geographically, it still plays a vital role in the global climate, as expedition leader Markus Rex from the Alfred Wegener Institute, Helmholtz Centre for Polar and Marine Research (AWI), explains.
“The air temperatures in the Arctic are rising twice as fast as in many other parts of the world,” he says, which is causing fundamental changes, such as a significant decrease in the surface area and thickness of sea ice in the summer periods.
“This also has an impact on the atmosphere over Central Europe,” the scientist adds. “The better we understand such interconnections, the better we’re able to include them in our climate models.” Doing so not only improves the simulations used to predict climate scenarios further in the future but also models used to forecast the weather for the days ahead.
According to Annette Rinke, one of the leaders of the MOSAiC modeling team, a climate model is essentially a huge arithmetic problem. “You need formulas that describe variables such as how much heat is exchanged between the atmosphere, the ground, and the ocean, how air masses move, how precipitation is distributed, and so on.” This is so, because the climate is dynamic. For example, if the average temperature goes up, then the ice in the Arctic Ocean becomes thinner and contains more areas of open water. Here, the water warms up more in the summer due to solar radiation and emits the heat back into the atmosphere for longer periods in the fall. As a result, it is necessary to improve the heat balance that the experts initially assumed. “This example shows why climate models can very quickly become very complex,” the AWI scientist says. “And that they will inevitably contain inaccuracies.”
Looking back to look into the future

To uncover the most serious errors, climate models are checked – against reality. For example, the researchers set up their regional models for the Arctic to begin in the year 1979, and then see if the models adequately depict the temperature distribution or the decline in summer sea ice in recent years. Only if the models pass this check with reasonable satisfaction can researchers trust the results indicated when the calculations are extended to the end of this century. To achieve greater certainty, the researchers usually compute several different climate models and alter individual parameters very slightly to obtain an array of different results. Doing so provides additional statistical certainty.
Nevertheless, Annette Rinke notes that, with regard to sea ice in particular, models linking the ocean and the atmosphere often indicate less loss than researchers actually observe each summer. “This tells us that there are feedbacks in and between both systems, which we have not yet sufficiently understood.” Researchers of course know how less ice impacts the heat budget and, conversely, further melting, which they have accounted for in the models’ algorithms. However, these processes alone are not enough to explain the discrepancy conclusively. “There must be others,” Rinke says. “In particular, we don’t yet understand well enough from an atmospheric point of view the role of mixed-phase clouds, which still contain liquid water at low temperatures, for the heat budget and the turbulent exchange of heat, moisture, momentum, and gases between the ocean and the first few meters of the atmosphere.”
From the depth of the oceans to the atmosphere
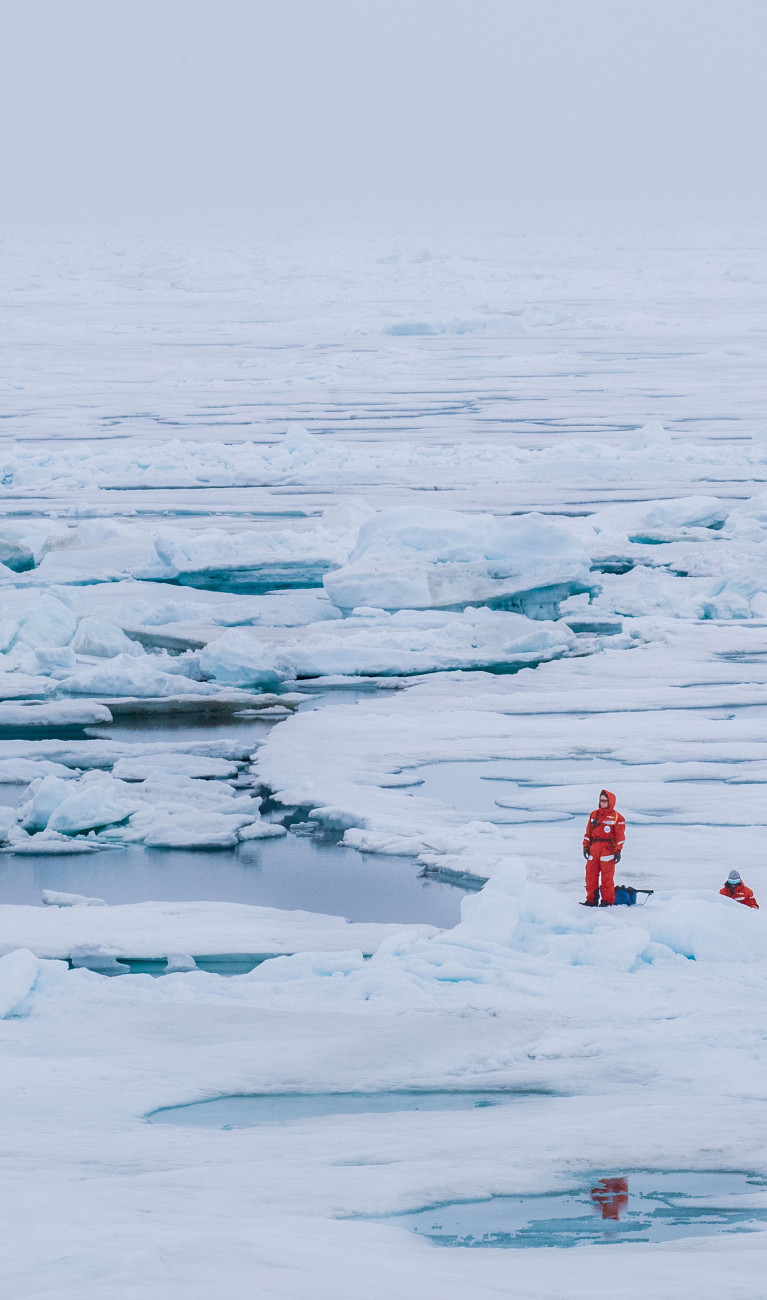
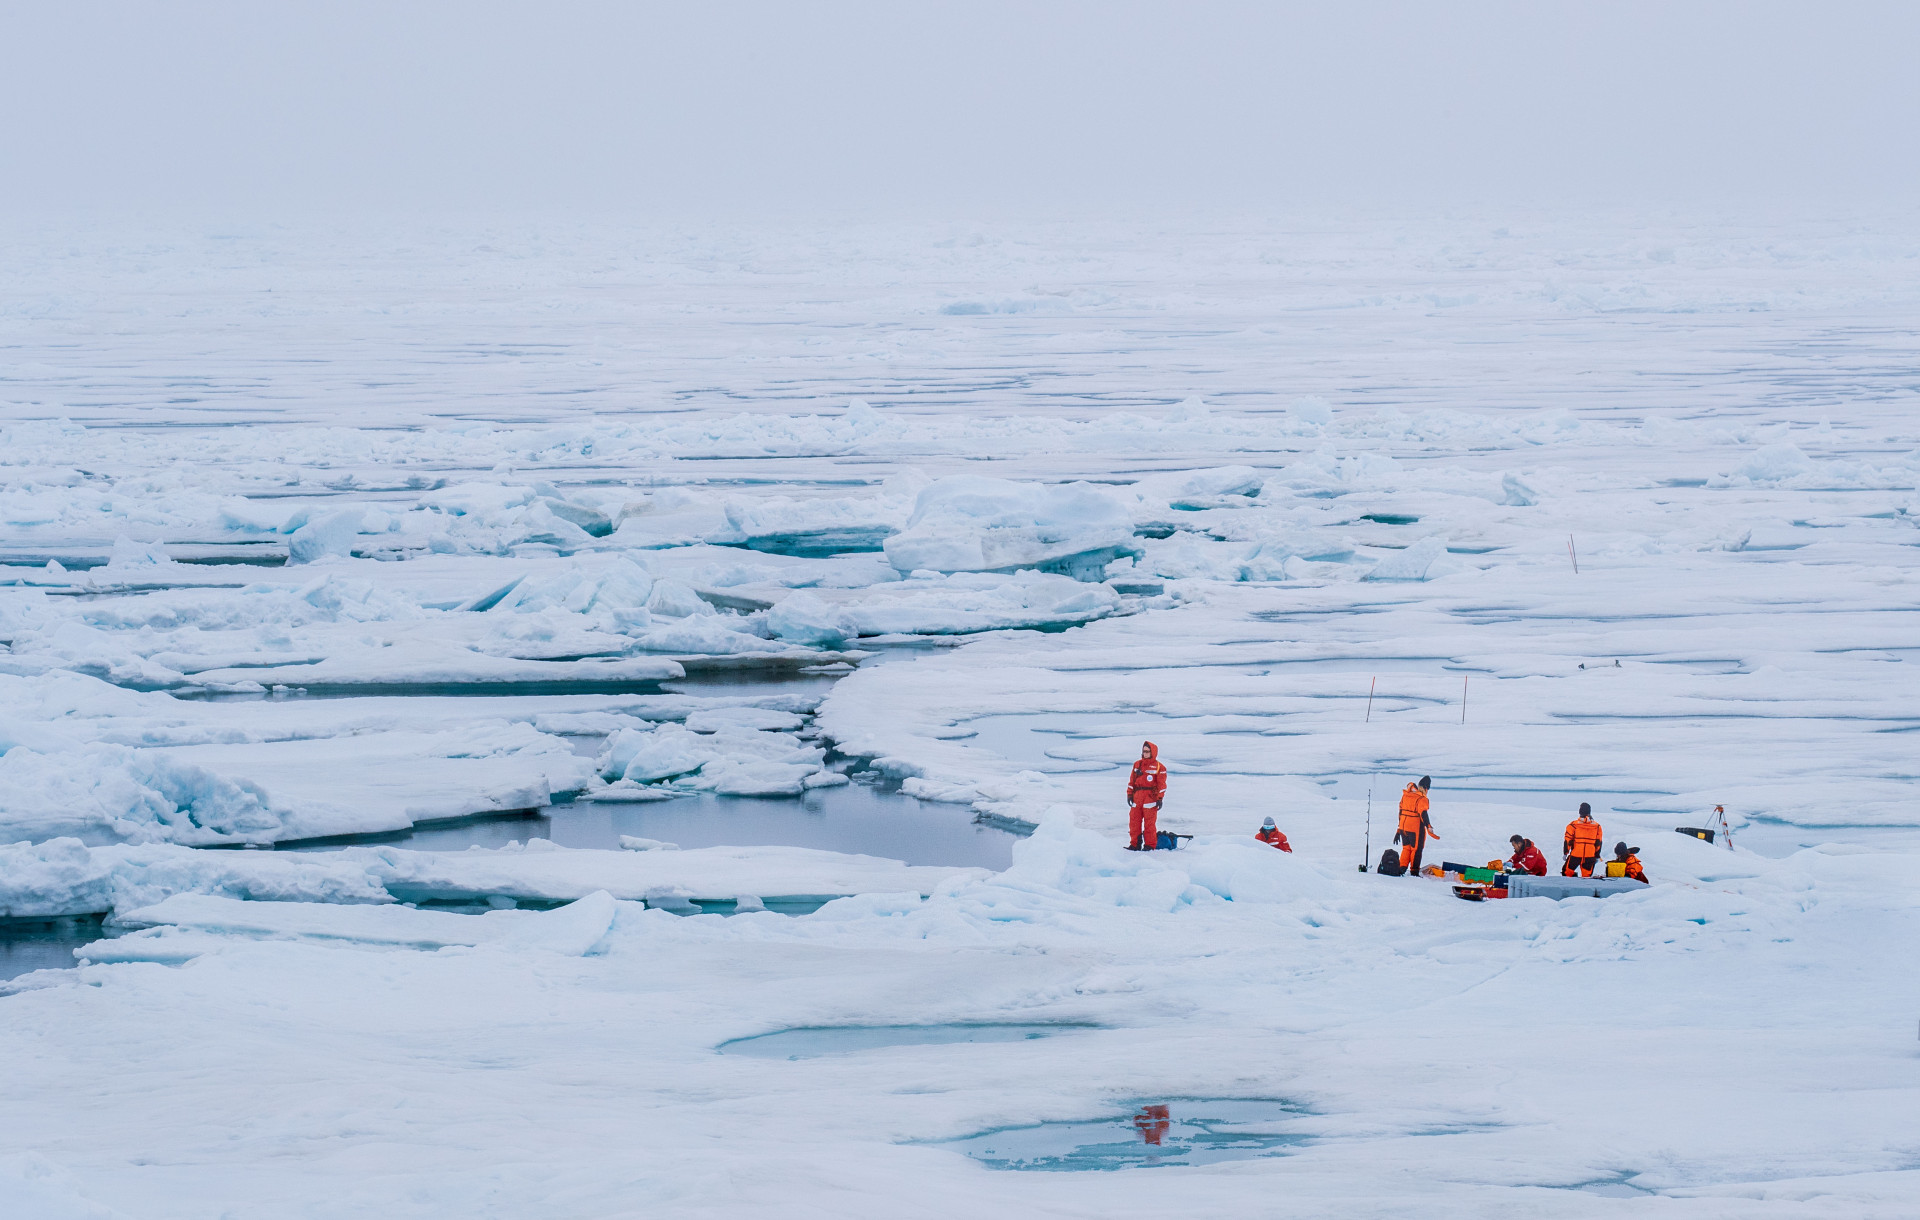
Wind speed, oxygen content in ice, water temperature – researchers collected a massive amount of data during the MOSAiC expedition. They made the measurements on, in, and under the ice, as well as up to four kilometers deep on the seabed and 35 kilometers high in the atmosphere.
Supercomputer with 100,000 processing cores
Climate models are computed at AWI in Bremerhaven and the German Climate Computing Center (DKRZ) in Hamburg, among other places. The DKRZ’s supercomputer is specialized in performing climate-related computations, which not only require a lot of power but also a lot of memory. The current computing system has more than 100,000 cores, says Jana Meyer from DKRZ. “The models are specifically programmed in a way that they can be broken down into lots of subtasks that the individual cores compute at the same time.” Just as important is the swift exchange of data between the cores, since many variables come together in the climate. According to Meyer, one good example is a storm, which spreads and moves in all three directions in space. The supercomputer must be able to handle this, too.


Over time, the resolution of the models has grown ever better. For global models, grid cells are now being computed that are just 2.5 by 2.5 kilometers in size. Meyer does the math, which works out to 84 million cells distributed across the globe. “We then have to add another 90 layers for the vertical dimension, which means 7.5 billion cells in the end.”
It therefore comes as no surprise that the computer technology quickly obsolesces as the climate models grow ever more complex. The DKRZ is going to replace its five-year-old supercomputer in 2021 with a new model that – just like the current one – will be among the top 100 supercomputers worldwide in terms of computing power. With regard to memory, it will even rank among the top 10.
Greater accuracy also for weather forecasts
This will facilitate even higher resolutions for climate models and make it possible to compute them with additional parameters that stem in part from the MOSAiC expedition. But greater accuracy is of far more than just academic interest, as Annette Rinke clearly illustrates using the Arctic as an example. “A precise sea-ice prediction is crucial to shipping, which continues to grow, since you can save time and fuel by using the northern routes.” The Arctic also impacts the weather in Central Europe. For example, if the ocean freezes over more slowly in late fall, then more heat and humidity rise up. Over several intermediate stages, this in turn disrupts the strong band of wind in our part of the world known as the jet stream. “As a result, weather patterns can stabilize and settle over Europe for a longer period of time.”
With the rapid changes in the Arctic, their impact on the climate in the middle latitudes is likely to become even stronger. “The data from the MOSAiC expedition offers us some key clues here,” says Rinke. “However, we won’t be able to answer all questions with this data.” This means the scientists will need to continue traveling to the region in the future as well in order to understand the climate system even better and improve the reliability of forecasts in the process.
Related links
Mediathek MOSAiC-Expedition
The approximately 170 scientists involved in MOSAiC have gathered a wealth of data to capture such details more precisely. Ellen Damm has been researching biogeochemical cycles in the Arctic for more than 20 years. “Such cycles include the pathways that the greenhouse gas methane will take as it circulates,” the AWI researcher says. It may be released from thawing permafrost or when gas hydrates dissolve on the seabed. “Many people think that the seabed goes plop, gas bubbles rise to the surface and then escape into the atmosphere.” That is not the case, however. “A larger part of it is oxidized in the water to carbon dioxide,” she says. “In addition, the ocean water is stratified in the summer. As a result, hardly anything is able to reach layers higher up. An exchange is only possible in the winter.” To date, there have been almost no precise measurements of this phenomenon, since most research expeditions take place in the summer.
Data for all
Antonia Immerz from the AWI explains that the data was gathered centrally in a 700-terabyte mass storage device on the Polarstern research icebreaker via the computer network expanded on the ice. Immerz was temporarily on board as data manager. After each leg of the journey, the data was taken to the AWI, where experts have also stored it centrally, thereby making it available to the scientific community. In addition to the measured values themselves, you will find metadata, too. This metadata provides information on such things as when a measurement was made, at what geographical location, and with what instrument and calibration. “This way, scientists can use the data for other research questions as well.” Over the next three years, the MOSAiC data will initially be available to participants for their projects. Beginning in 2023, the data will then be made available to the public for free.
MOSAiC was a golden opportunity for Ellen Damm. From December 2019 to June 2020, she was on board the Polarstern or at the measuring points on the ice. With her team, she took ice cores and water samples to determine their chemical composition.
The researcher, now back in Bremerhaven, is excited. “We have great data,” she says. This means that she and her team will now finally be able to more precisely quantify the suspected pathways of methane, as well as chemical reactions. The analysis is still underway, but the first scientific publications are being prepared. Other colleagues will review and discuss these publications so that the scientists can gain an even better picture of how the methane cycle in the Arctic works. These findings will then be translated into program codes to further improve climate models.
Many researchers feel the same way as Ellen Damm. “With MOSAiC, we have collected unique data, especially on the coupled climate system of the Arctic in winter,” says Annette Rinke, who, as a modeler, has a good overview. “It enables us to understand key processes better and to work them into models.” She adds that a little patience is necessary, though. “Four to five years may well go by before the first new inputs make it into climate models.”